Overview of my Job:
What I am doing for Mrs. Mervin Graham, is essentially a giant editing session. When many of the data layers for the Baldwin County Zoning map were made, they were done so very quickly. Even the most professional of users can make mistakes quite frequently and easily using arcGIS if they do not take their time, and that is exactly the case with this map. There were thousands of small errors that summed to a very problematic dataset. Basically, Mrs. Graham would give me a set of instructions when she wanted me to add something to the map or to get something done with it, and I would do that, on top of fix any and every error I saw.
Workplace
I was able to work on this in multiple locations. I started out working on it at city hall. Following that I worked for about a month at the GCSU Geographic Research Commons. For the last few weeks, I worked primarily at my apartment once I got the software up and running on my personal desktop. Below are images showing my workstation for all locations.
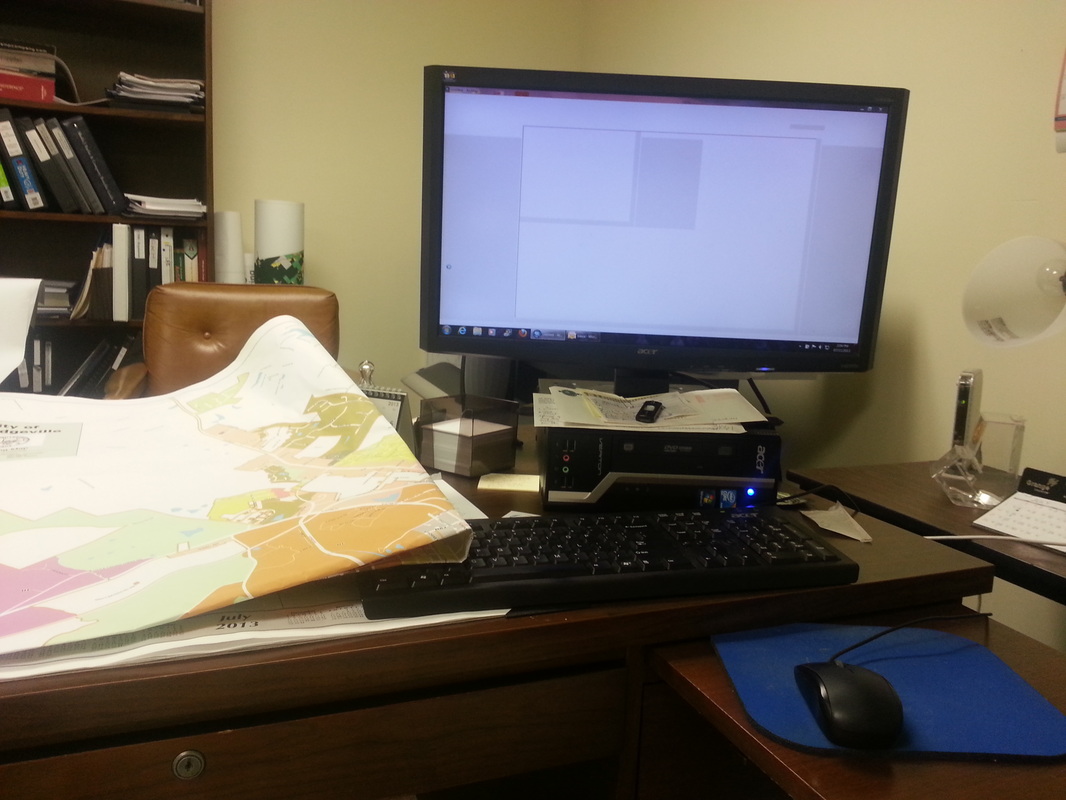
This is my humble beginning at the City Hall Annex. This computer and I never got along really well, but it is what it is. If you look closely, you can see the computer doing its favorite thing, giving the blue circle of doom. I am not sure of the exact specifications of the system, but I can tell you for a fact, that it is nowhere near powerful enough to efficiently use the ESRI programs.
|
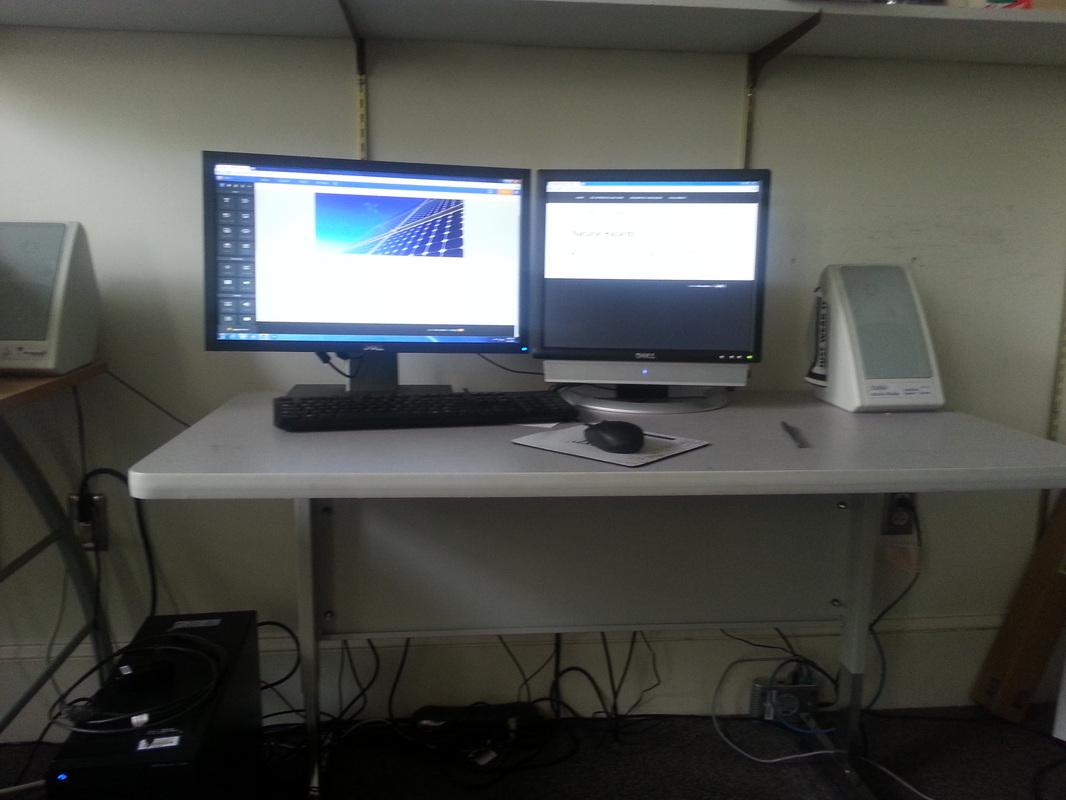
This is where things picked up. This is my station at GCSU. This computer was much quicker and made the process a lot more enjoyable. It had 8GB of RAM, which is a definite improvement over the city hall computer. It was able to use the ESRI programs much more effectively and quickly.
|
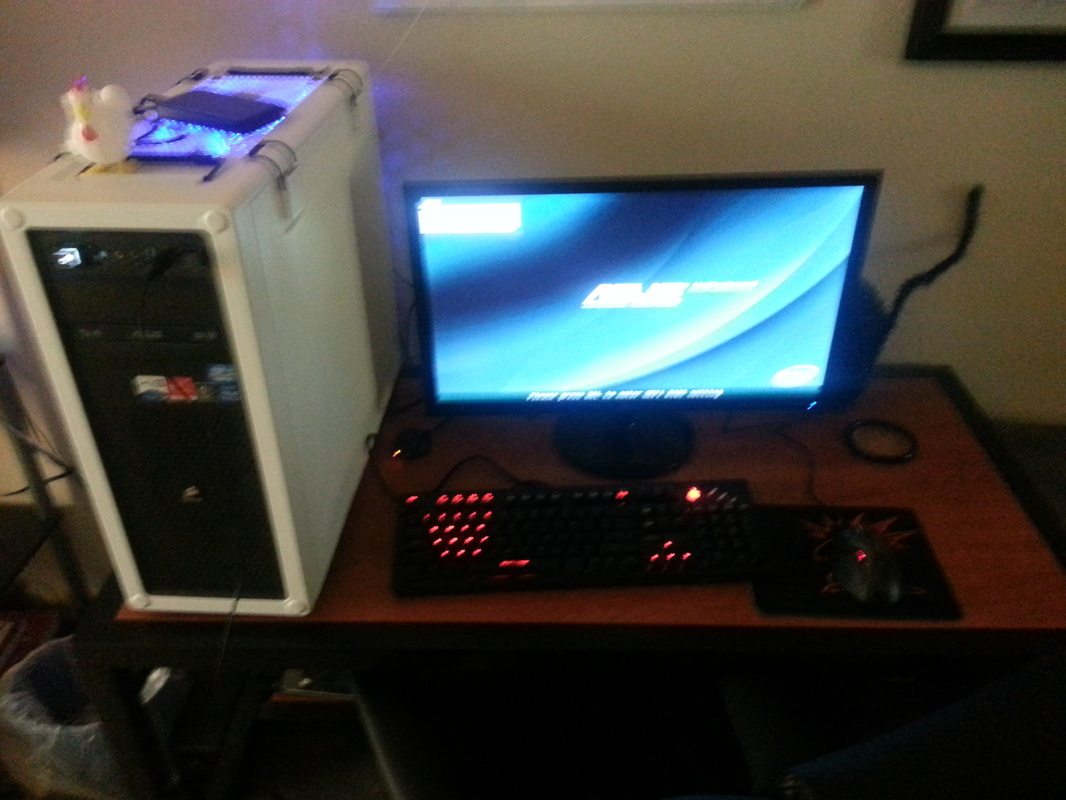
This is where my work concluded. This is my personal desktop that I built myself. It was more than powerful enough to run the software, and actually ended up being the fastest system I was able to use it for. The biggest reason it was so quick is due to the fact that I had the ESRI programs installed onto a Solid State Disk Drive (SSD). SSD's use flash memory, which is much quicker to access. That coupled with the 8GB of RAM on my computer made running the ESRI programs a breeze on this computer.
|
Results:
Here are a few screen shots showing examples of what I did, along with screenshots of the final map.
The before shots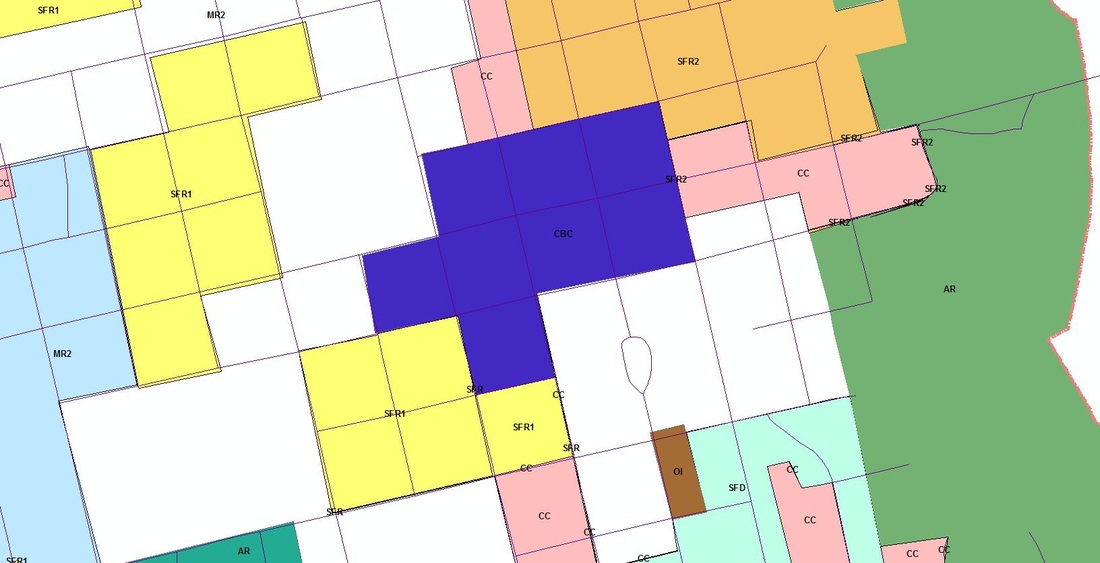
|
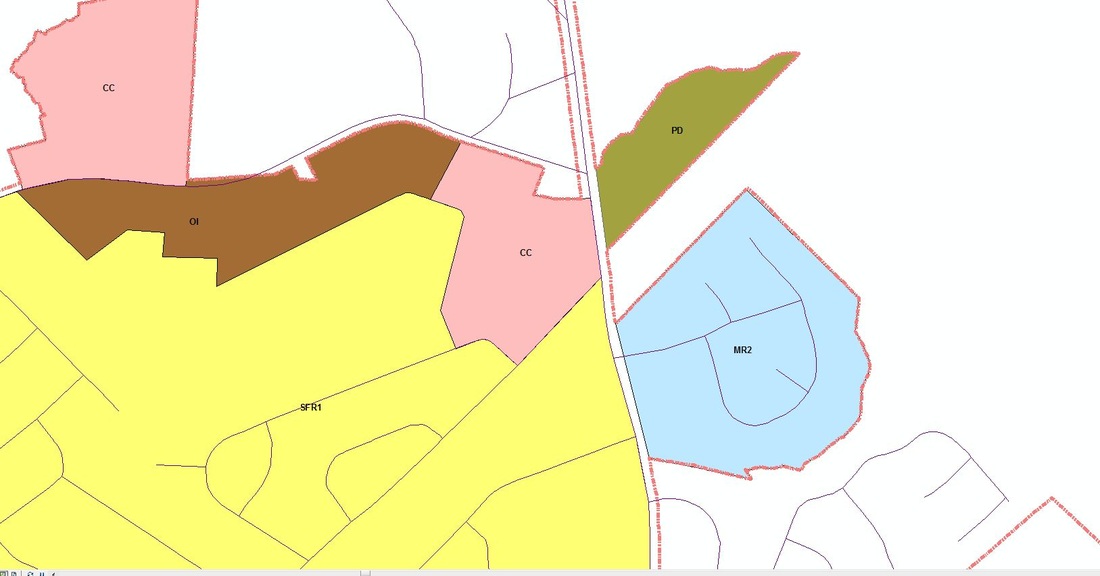
The after shots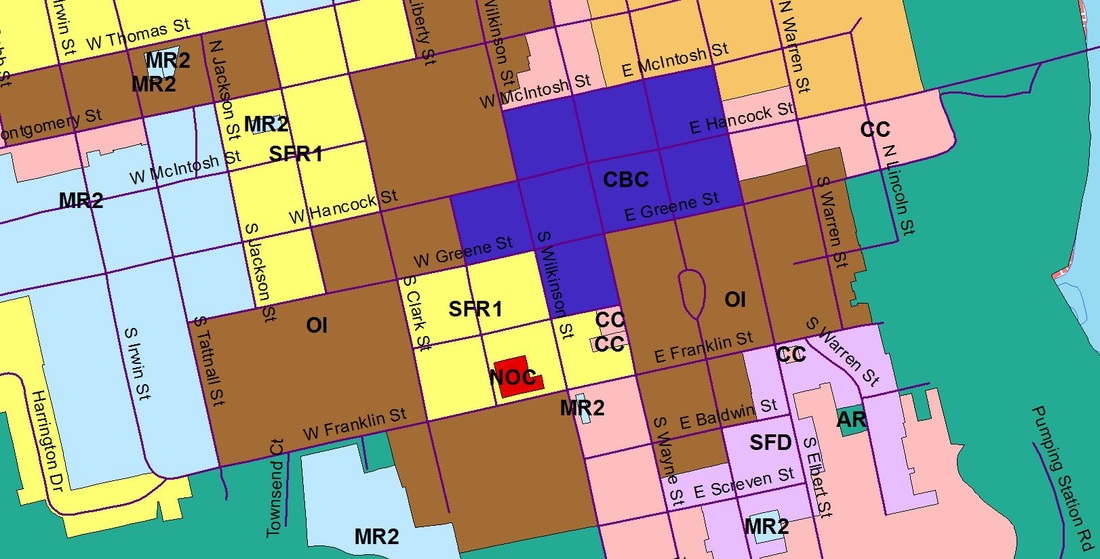
|
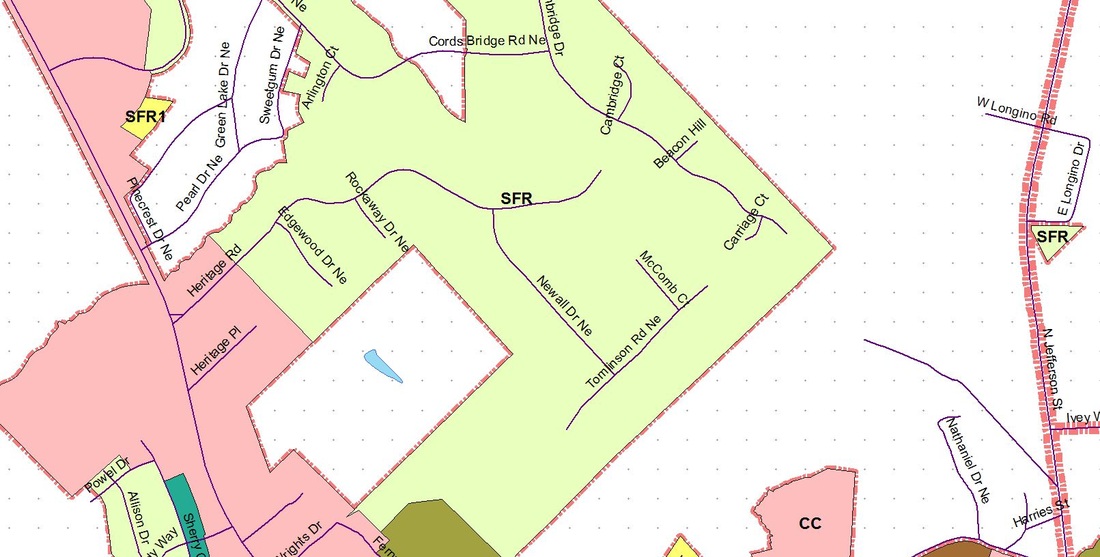
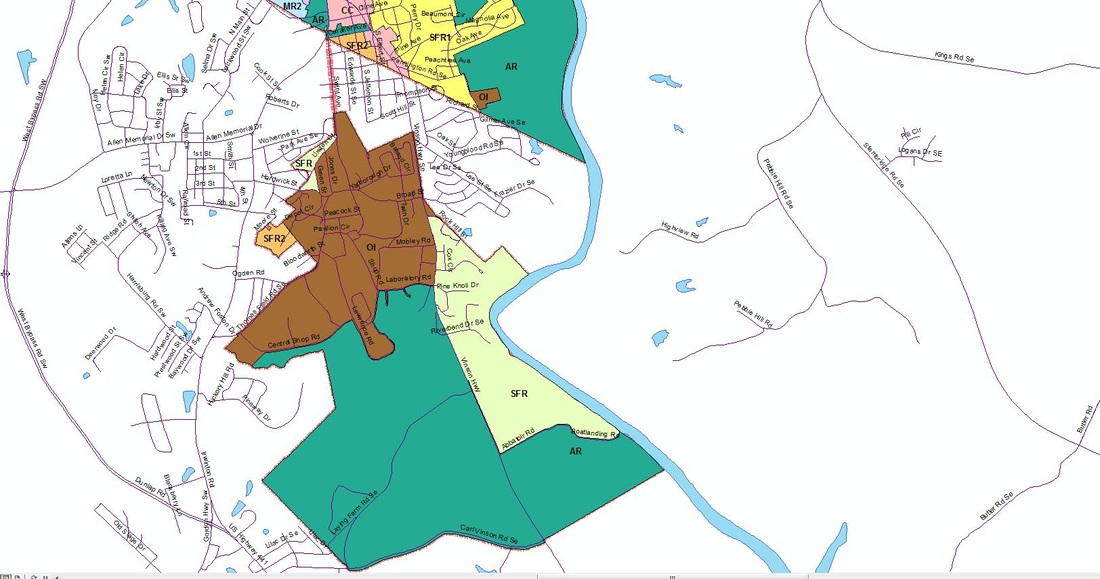
In this one, the difference is quite clear. Not only did I have to add a substantial amount to the final map, but there are several misaligned edges that are quite apparent, as well as the labeling changes.
|
|
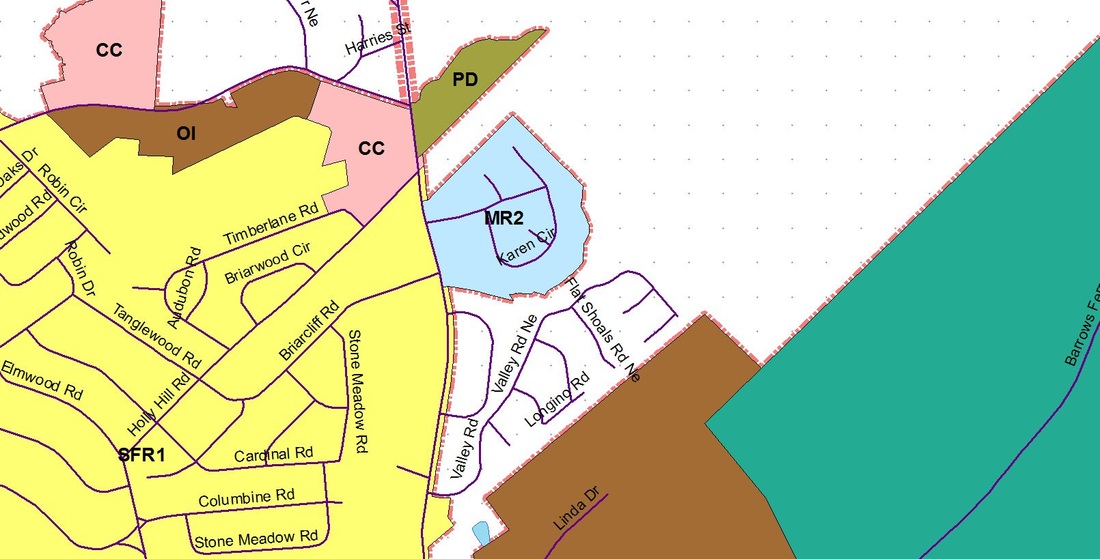
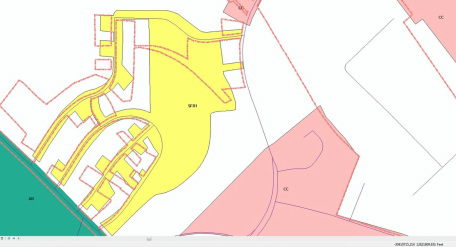
The differences are a little harder to spot in these images, however there were a lot of zoning boundaries that overlapped with parcel, road, city limit, and other zoning boundaries where they shouldn't have.
|
|
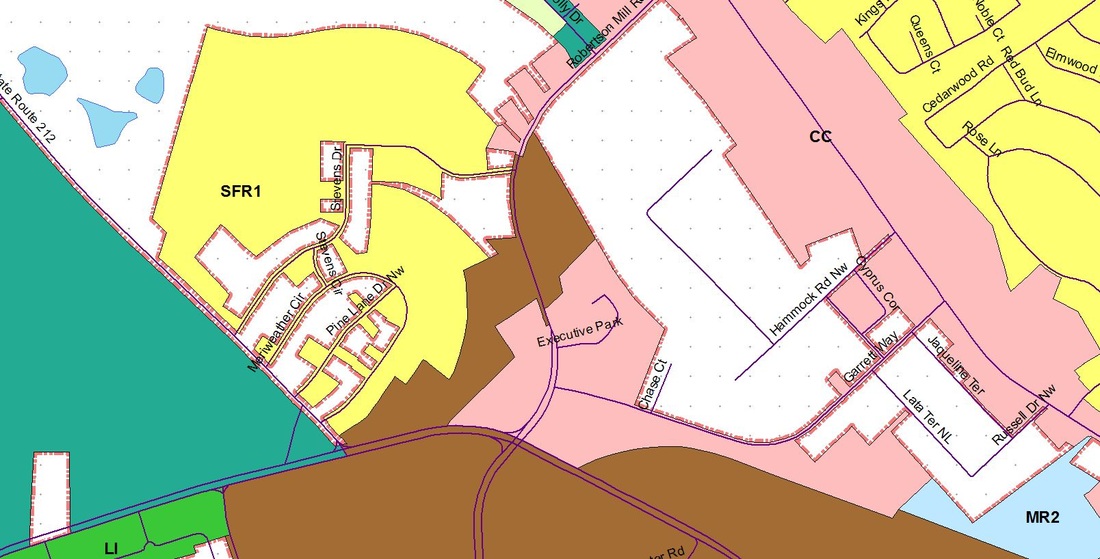
It can be easily observed in these images that the city limits (orange lines) do not coincide at all with the zoning boundaries, which they most certainly should since the city does not zone outside the city limits.
|
|
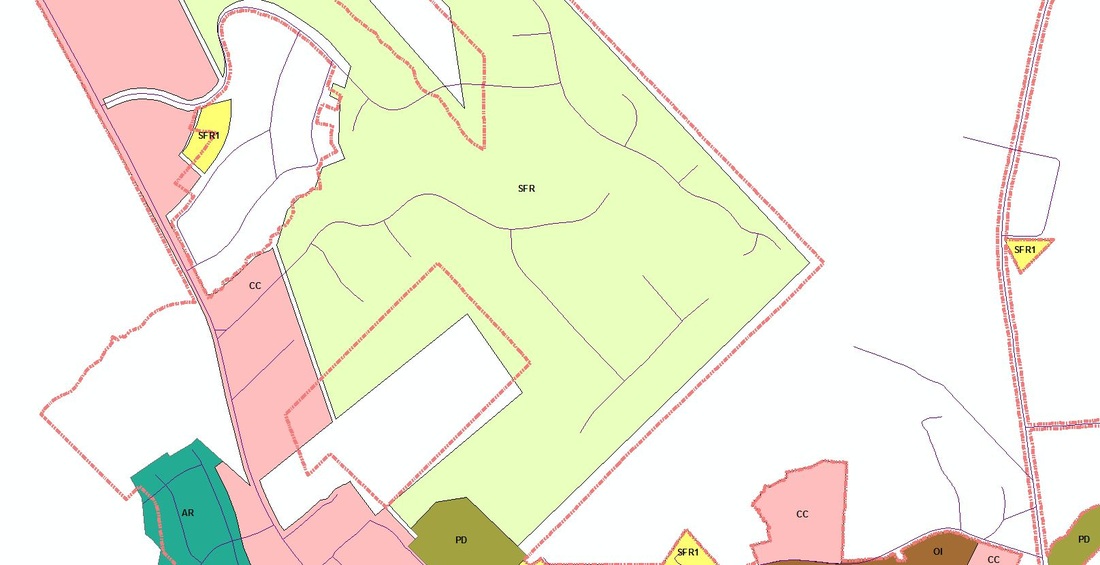
This is another area that was pretty much a complete transformation. The before picture looks almost nothing like the after picture.
|
|
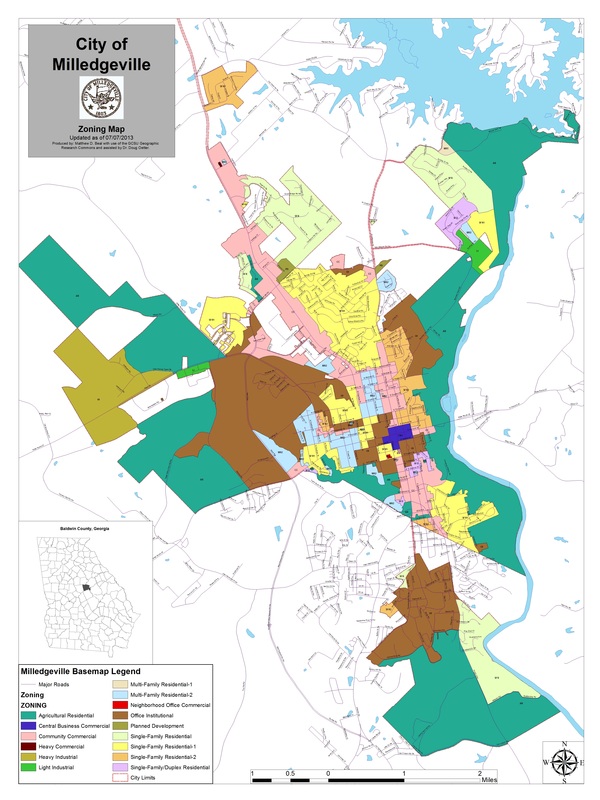
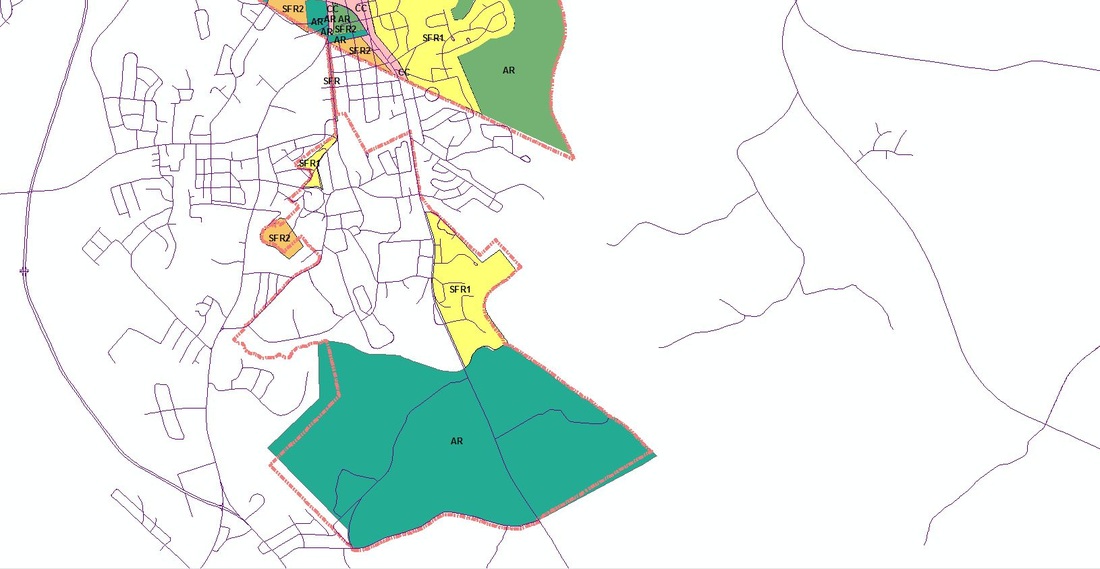
This is the final map in full layout view. All of the metadata was produced from scratch by me. I am quite pleased with the way it turned out, despite all the stresses that came with the job.
Highs and Lows
|
Highs:
|
Lows:
|
